
International Vulnerability Index

The International Vulnerability Index app was made to help a US government stakeholder gain a high level understanding of international vulnerability indicators inside multiple countries. Some examples of vulnerability indicators would be national life expectancy, statistics on violence against women, or renewable energy use.
The app combines a variety of different real time, near real time, and static data sources to showcase important information about each country.
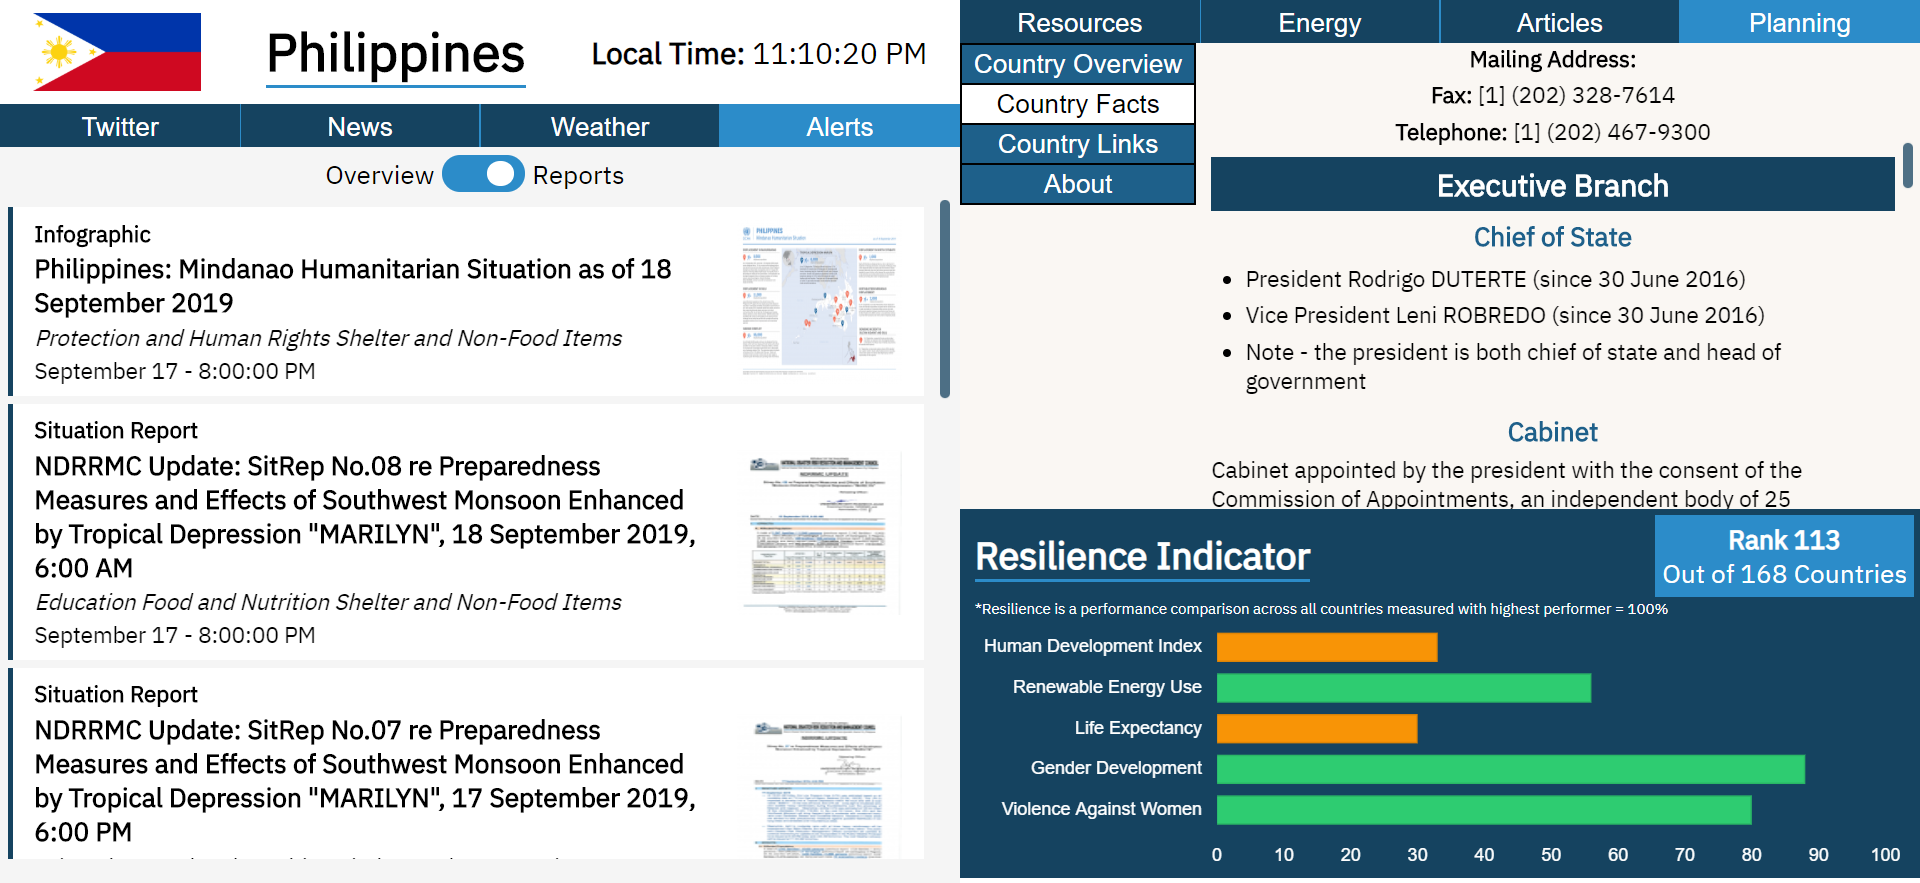
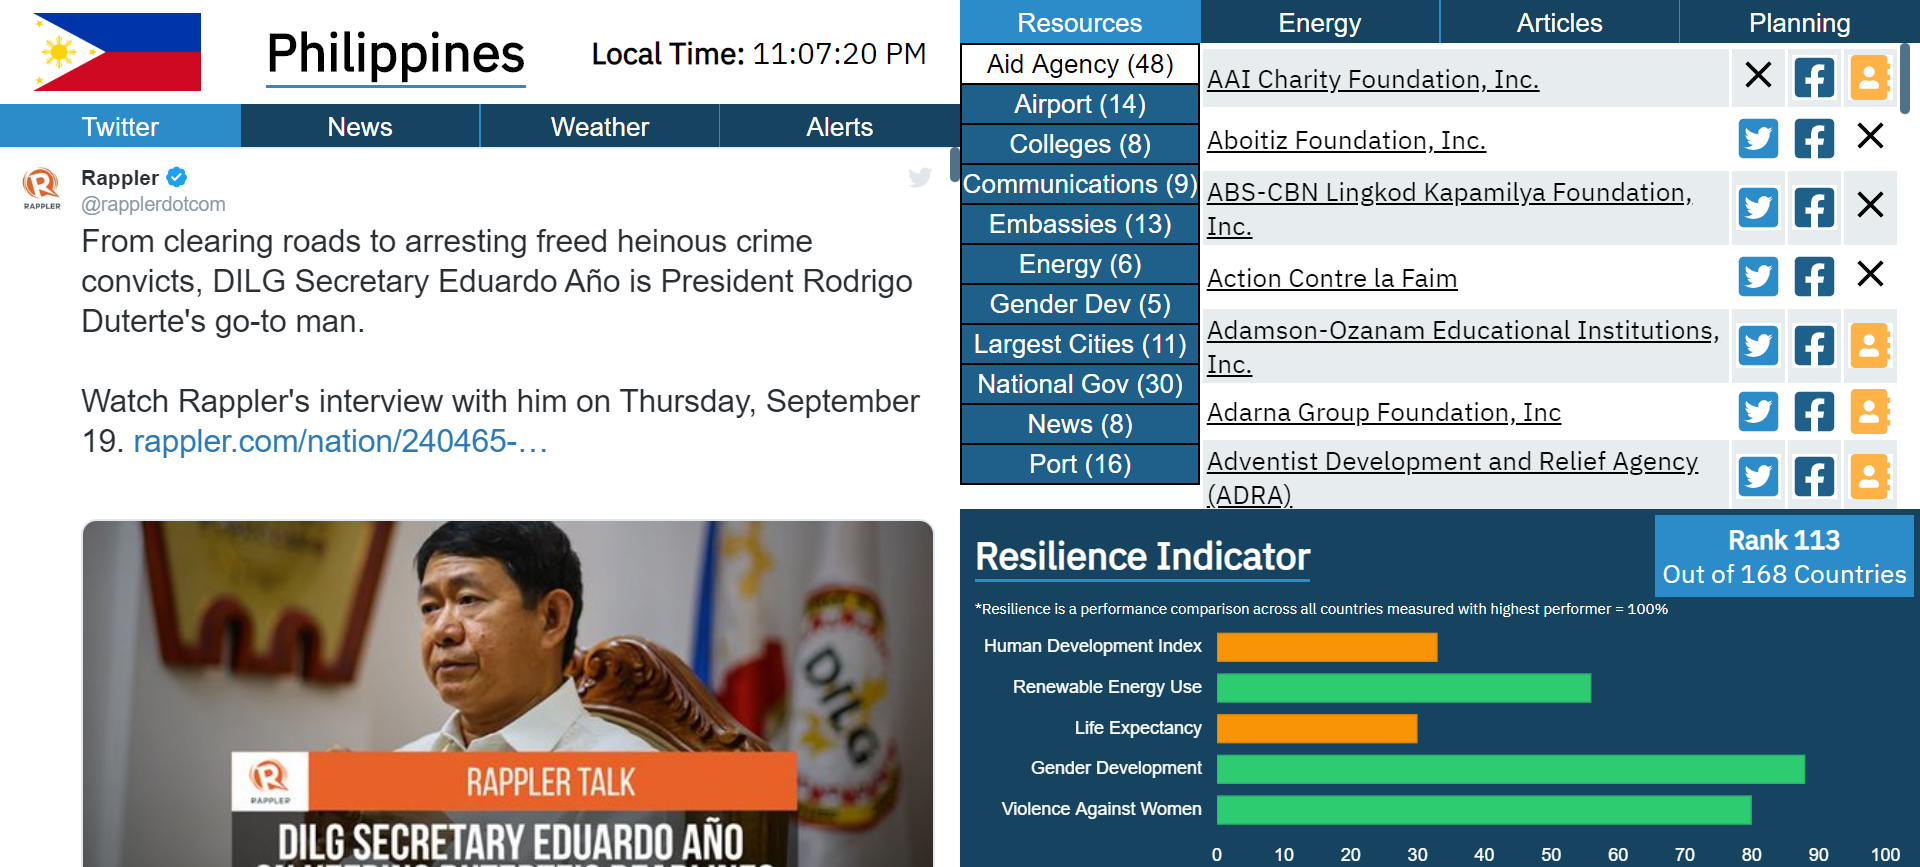
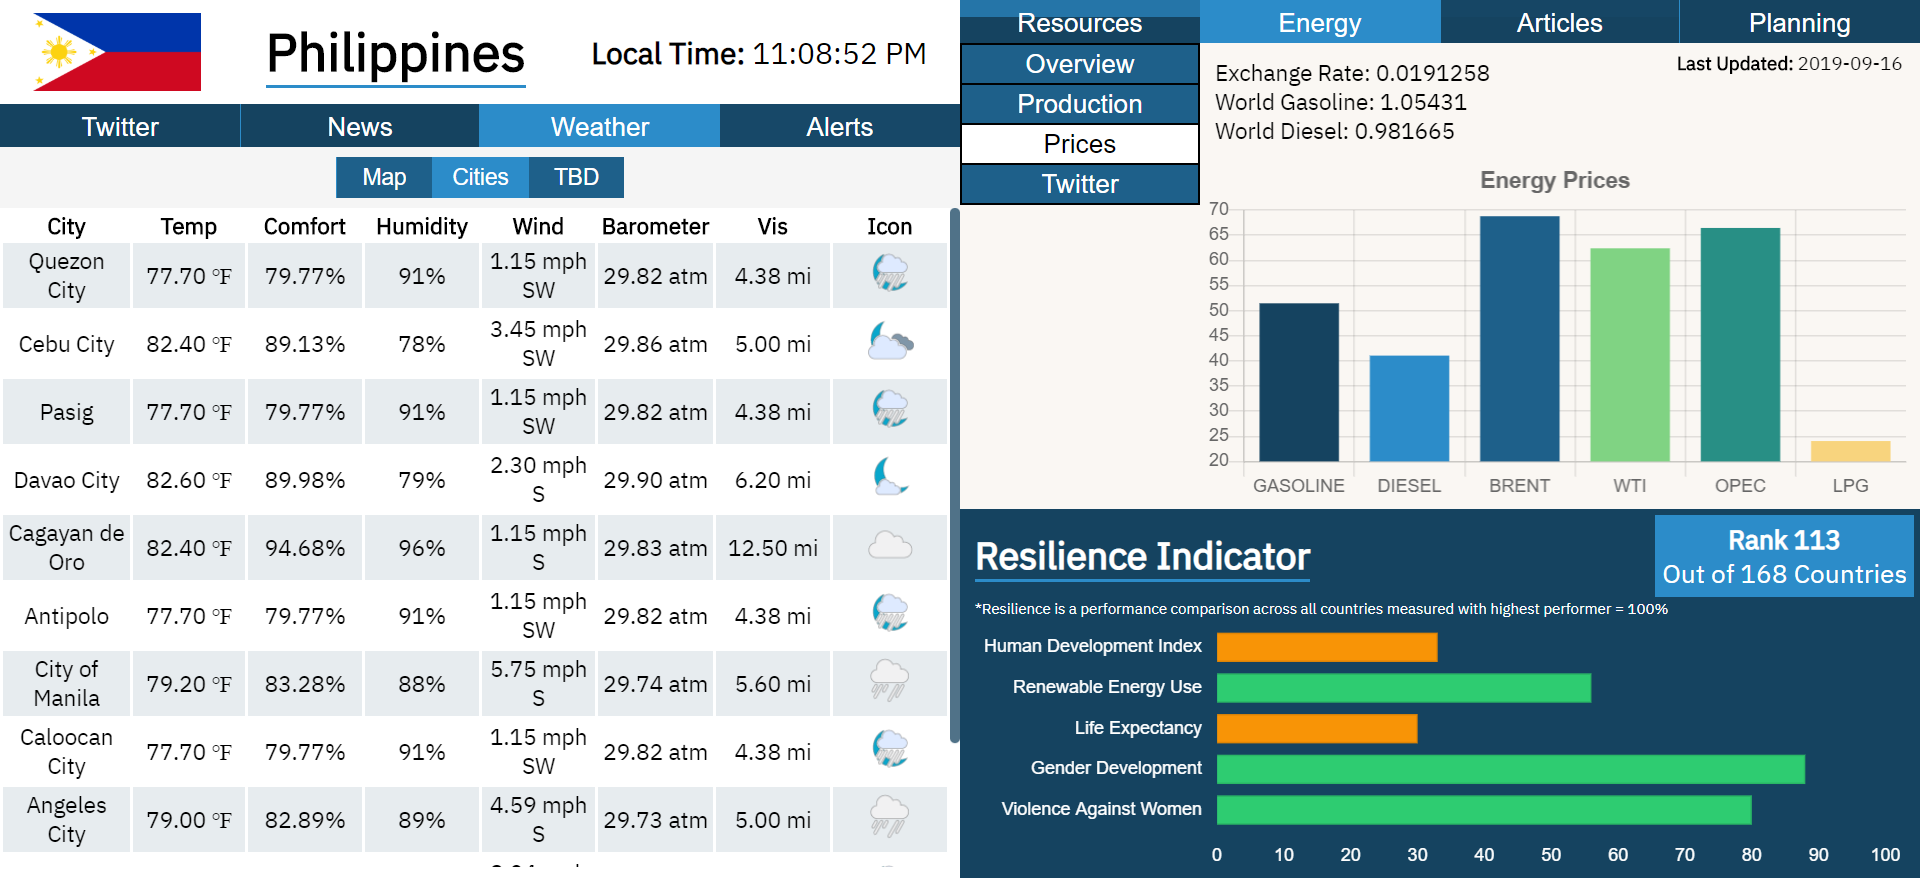
The layout of the app is broken into data feeds on the left and more static data on the right. The left column displays a curated twitter feed of important actors in the region, detailed weather data for important cities inside the country, a news feed with custom search parameters, and an additional feed of Relief Web reports and media.
The right side column includes social media, website, and contact information for important national businesses and government offices in addition to tabs focusing on energy and country specific data taken from the CIA World Factbook.
The last element is the resilience indicator chart that visually summarizes data taken from other parts of the app to help the user compare the current country to the rest of the world.